A list and/or spatial map of the sites where the organisation has assets and/or activities: In its direct operations and upstream and downstream value chain(s), where material nature related dependencies, impacts, risks, and opportunities have been identified, and whether any of these sites meet the criteria for sensitive sites; and; In its direct operations and, where possible upstream and downstream value chain(s), that are in sensitive sites. Other sites where the organisation has potentially material nature-related dependencies, impacts, risks and opportunities.

Cerulean Warble
Near Threatened
IUCN Red List of Threatened Species
How IBAT can support nature-positive goals
IBAT provides fast, easy access to global biodiversity data and reports, helping your business assess biodiversity risks, inform sustainability strategies, and meet key disclosure requirements.
Access the world’s most authoritative biodiversity data
Book a short call with our team to explore how we can support your requirements. Find out more about pricing and collaborations.
IBAT is powered by world-class, authenticated biodiversity data, informed by hundreds of the world’s leading scientists and experts.
Biodiversity Risk Screening
Assess biodiversity-related risks across project sites, supply chains, and investments to make informed, decisions. Identify critical habitats in line with IFC Performance Standard 6 and World Bank ESS6, support excellence in global project planning and risk management.
Biodiversity Disclosure
Support due diligence efforts with accurate, science-based biodiversity insights. Streamline your sustainability reporting and regulatory compliance programmes by integrating data into disclosure frameworks such as TNFD, CSRD, and GRI.
Biodiversity Strategy
Ensure responsible site selection and policy alignment with global conservation priorities. Strengthen your biodiversity commitments by identifying and avoiding development near sites important for biodiversity such as Alliance for Zero Extinction (AZE) sites and UNESCO World Heritage Sites.
Nature Positive Opportunities
Align your business operations with a nature positive approach to drive sustainable impact. Identify opportunities to help progress global conservation goals with STAR (Species Threat Abatement and Restoration).
IBAT Platform features
Using the IBAT platform you can access this data and generate tailored global biodiversity insights.
.png)
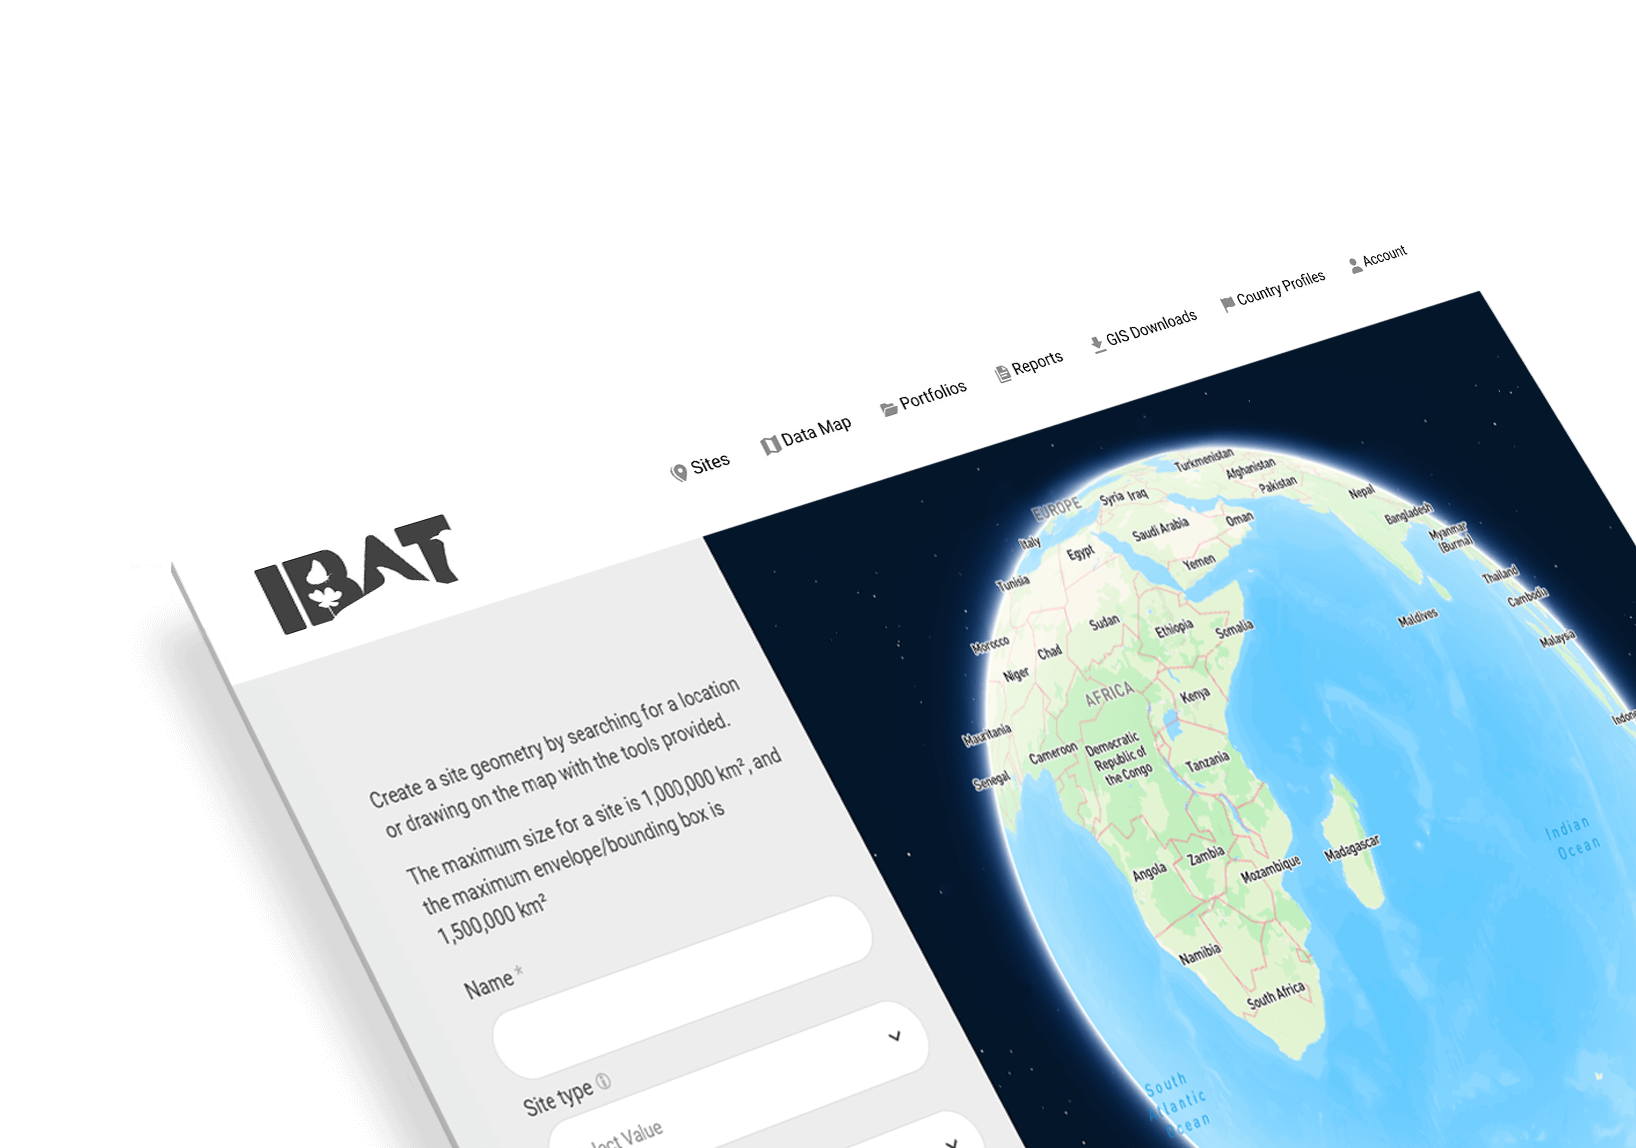
Upload site information easily
Do you have a list of sites you would like to plug into the platform?
Upload large portfolios of your project sites, supply chains, and investments in bulk choosing from a range of formats including ESRI, KML, KMZ or Excel.

Access global spatial data
Download GIS (Geographic Information System) shapefiles for IUCN Red List species, the World Database of Protected Areas (WDPA), and Key Biodiversity Areas (KBAs) for custom analysis.
Do you require automated access to the latest monthly dataset updates? Leverage our API (Application Programming Interface) to ensure you always have the most up to date information at your fingertips

Generate biodiversity reports
Ensure alignment with biodiversity strategies and support Nature Positive commitments with clear, actionable insights. Download tailored reports for biodiversity risk assessments (PS6, ESS6) or disclosure requirements such as GRI (Global Reporting Initiative), TNFD (Taskforce on Nature-related Financial Disclosures) and CSRD (Corporate Sustainability Reporting Directive)

Visualise your biodiversity footprint
Easily assess potential risks and inform strategic decision-making. Generate maps to view your sites in relation to biodiversity-sensitive areas, including Protected Areas and KBAs.
Empowering your world-shaping decisions
Our global users range from those with a lot of experience working with Global Information Services (GIS) and other data files to those completely new to it.
Prioritise sites with IBAT’s Disclosure Preparation Report
The IBAT Disclosure Preparation Report (DPR) is designed to support you with the identification and prioritisation of sites with potential biodiversity impacts. The report helps you assess the proximity of operational sites to biodiversity sensitive areas, such as Key Biodiversity Areas (KBAs)and Protected Areas, and evaluates biodiversity risk based on Species Threat Abatement and Restoration (STAR) metric scores. By highlighting and prioritising these sensitive locations, this report enables the management and mitigation of biodiversity impacts and supports sustainability commitments.
Recognised across key biodiversity frameworks
Leveraging IBAT data ensures that your organisation stays at the forefront of credible biodiversity data insights, analysis, and reporting. IBAT is cited by and can assist with major frameworks, including CSRD, TNFD, GRI, CDP, and the Science Based Targets for Nature.

How the DPR supports your disclosures
TNFD provides a risk management and disclosure framework to help organisations assess, report, and respond to nature-related risks and opportunities. IBAT supports businesses in aligning with TNFD by providing critical biodiversity data to inform risk assessments, impact evaluations, and disclosure preparations.
The ‘Locate’ Phase
TNFD requires that organisations disclose the sites of assets and/or activities in the organisation’s direct operations and, where possible, upstream, and downstream value chain(s) that meet the criteria for sensitive sites. TNFD defines priority sites as material and/or sensitive sites:
- Material sites: Sites where an organisation has identified material nature-related dependencies, impacts, risks and opportunities in its direct operations and upstream and downstream value chain(s); and/or
- Sensitive Sites:
- Areas important for biodiversity; and/or
- Areas of high ecological integrity; and/or
- Areas of rapid decline in ecosystem integrity; and/or
- Areas of high physical water risks; and/or
- Areas of importance for ecosystem service provision, including benefits to Indigenous Peoples, Local Communities, and stakeholders.
This report provides an assessment of whether each site is a sensitive site based on the presence of protected areas, KBAs, and threatened species in and around each site. A site is identified sensitive if: any protected area or KBA falls entirely or partly within the site or buffered area or; The STAR Threat Abatement and/or STAR Restoration scores exceeds the global median value.
Protected area, KBA and species lists are provided in a separate pdf that contain details about all the sites which are identified as sensitive. Important note: This report currently only assesses sensitive sites that are important for biodiversity. It is important to consider the other TNFD criteria when determining whether a site is a sensitive site, and therefore potentially a priority site.
Under the TNFD Strategy D disclosure requirement on priority sites, companies are expected not only to disclose the full list of the sensitive sites but also to provide “a description of how the organisation has defined sensitive sites, with reference to the tools, data sources and indicators and metrics used” and “a description of the process followed to identify priority sites for disclosure”. Table 4 outlines how this report can be used to respond to Strategy Disclosure D.
Table 1. Overview of requirements for TNFD recommended disclosure Strategy D and the Locate phase of TNFD’s LEAP approach that can be supported with the data provided by the IBAT
Strategy Disclosure D Requirements
Outputs to Use from IBAT
Maps of each site are provided. Boundaries of protected areas and KBAs are overlain to illustrate proximity to important biodiversity and conservation features. Each site is assessed as either sensitive or not sensitive according to the datasets hosted within IBAT. A site is identified sensitive if any protected area or KBA fall entirely or partly within the buffered area or if the STAR Threat Abatement and/or STAR Restoration scores exceeds the global median value.
A description of how the organisation has defined sensitive sites, with reference to the tools, data sources and indicators and metrics used.
Reference sensitivity scoring section of methodology. Reference IBAT using reference provided. Reference data sources used by IBAT to create this report:
World Database on Protected Areas
World Database of Key Biodiversity Areas
IUCN Red List of Threatened Species
Species Threat Abatement and Restoration Metric (STAR)
(References for data found in ReadMe).
A description of the process followed to identify priority sites for disclosure.
Can reference the DPR methodology for prioritisation in stage 2.
The Global Reporting Initiative (GRI) sets internationally recognized sustainability reporting standards, including biodiversity disclosures under GRI 101. IBAT helps organizations align with GRI by providing reliable biodiversity data to assess impacts ensuring transparent and informed reporting.
Global Reporting Initiative (GRI) Disclosure 101-4 'Identification of biodiversity impacts' and Disclosure 101-5 'Sites with biodiversity impacts' within GRI 101: Biodiversity 2024.
Table 2. Overview of requirements for Global Reporting Initiative (GRI) Disclosures 101-4 and 101-5 that can be supported with IBAT.
Disclosure 101-4 and 101-5 Requirements
Outputs to Use from IBAT
101-4-a. explain how it has determined which of its sites and which products and services in its supply chain have the most significant actual and potential impacts on biodiversity'. This is the only disclosure under 101-4. All the rest of the disclosures in the table are under 101-5.
IBAT helps determine which sites potentially have the most significant impact on biodiversity by providing information on the ecological sensitivity of the area in and around a site. Sites assessed as sensitive are sites where direct operations are likely going to have the most significant impacts on biodiversity. (The extent to which the activities at the operational sites lead to direct drivers of biodiversity loss should also be considered).
101-5-a. report the site and size in hectares of its sites with the most significant impacts on biodiversity.
The report presents the geographic site (name and coordinates) of each site assessed to be in a sensitive site.
101-5-b. for each site reported under 101-5- a, report whether it is in or near an ecologically sensitive area, the distance to these areas, and whether these are: areas of biodiversity importance;
- areas of biodiversity importance;
- areas of high ecosystem integrity;
- areas of high physical water risks;
- areas important for the delivery of ecosystem service benefits to Indigenous Peoples, local communities, and other stakeholders;
A site is in an ecologically sensitive area when it is completely or partially located in the ecologically sensitive area. A site is near an ecologically sensitive area when the ecologically sensitive area does not overlap the site, but it falls within the area of influence or within the radius set by the organization. The organization is required to report the distance only in cases where the site is near an ecologically sensitive area. The organization should report the size in hectares of the ecologically sensitive areas within its sites. IBAT can provide information on areas of biodiversity importance.
CSRD mandates comprehensive sustainability disclosures, including biodiversity and ecosystem impacts, under ESRS E4. IBAT enables companies to meet CSRD requirements by offering trusted biodiversity data, helping businesses assess dependencies, impacts, and risks across their value chains.
Table 3. Overview of requirements from ESRS4 that can be supported with IBAT.
Disclosure Requirement from ESRS 4
Outputs to Use from IBAT
Disclosure Requirement SBM 3 –Material impacts, risks and opportunities and their interaction with strategy and business model.
16. The undertaking shall disclose:
(a) a list of material sites in its own operations, including sites under its operational control, based on the results of paragraph 17(a). The undertaking shall disclose these locations by:
i. specifying the activities negatively affecting biodiversity sensitive areas;
ii. providing a breakdown of sites according to the impacts and dependencies identified, and to the ecological status of the areas (with reference to the specific ecosystem baseline level) where they are located; and
iii. specifying the biodiversity-sensitive areas impacted, for users to be able to determine the location and the responsible competent authority with regards to the activities specified in paragraph 16(a) i.
(c) whether it has operations that affect threatened species.
- A list of sites in or near biodiversity sensitive areas.
- IBAT provides data that can help determine the ecological status of sites.
- Details of which threatened species are potentially found within and around each site.
Disclosure Requirement related to ESRS 2 IRO-1 Description of processes to identify and assess material biodiversity and ecosystem-related impacts, risks, dependencies and opportunities.
17. The undertaking shall describe its process to identify material impacts, risks, dependencies and opportunities. The description of the process shall include whether and how the undertaking:
(a) identified and assessed actual and potential impacts on biodiversity and ecosystems at own site locations and in the upstream and downstream value chain, including assessment criteria applied;
(b) identified and assessed dependencies on biodiversity and ecosystems and their services at own site locations and in the upstream and downstream value chain, including assessment criteria applied, and, if this assessment includes ecosystem services that are disrupted or likely to be;
19.The undertaking shall specifically disclose whether or not it has sites located in or near biodiversity-sensitive areas and whether activities related to these sites negatively affect these areas by leading to the deterioration of natural habitats and the habitats of species and to the disturbance of the species for which a protected area has been designated.
- Metrics which indicate the ecological status in around sites which can be used when determining material impacts, risks, dependencies, and opportunities.
- A list of sites in or near biodiversity sensitive areas.
Disclosure Requirement E4-2 – Policies related to biodiversity and ecosystems.
24. The undertaking shall specifically disclose whether it has adopted:
(a) biodiversity and ecosystem protection policy covering operational sites owned, leased, or managed in or near a biodiversity sensitive area; [...]
- A list of sites in or near biodiversity sensitive areas.
Disclosure Requirement E4-5 – Impact metrics related to biodiversity and ecosystems change.
27. When preparing the information required under this Disclosure Requirement, the undertaking shall consider and may describe: [...]
(c) the biodiversity components of the metrics: species specific, ecosystem specific; [...]
33. The undertaking shall report metrics related to its material impacts on biodiversity and ecosystems.
35. If the undertaking identified sites located in or near biodiversity-sensitive areas that it is negatively affecting (see paragraph 19(a)), the undertaking shall disclose the number and area (in hectares) of sites owned, leased or managed in or near these protected areas or key biodiversity areas.
40. If the undertaking identified material impacts related to the state of species, the undertaking may report metrics it considers relevant. The undertaking may:
(b) consider population size, range within specific ecosystems as well as extinction risk. These aspects provide insight on the health of a single species’ population and its relative resilience to human induced and naturally occurring change;
(c) disclose metrics that measure changes in the number of individuals of a species within a specific area;
(d) disclose metrics on species at extinction risk that measure:
i. the threat status of species and how activities/pressures may affect the threat status; or [...]
41. If the undertaking identified material impacts related to ecosystems, it may disclose:
(b) with regard to ecosystems condition:
ii. metrics that measure multiple species within an ecosystem rather than the number of individuals within a single species within an ecosystem (for example: scientifically established species richness and abundance indicators that measure the development of (native) species composition within an ecosystem against the reference state at the beginning of the first reporting period as well as the targeted state outlined in the Kunming-Montreal Global Biodiversity Framework, or an aggregation of species’ conservation status if relevant); or [...]
- Species and ecosystem metrics which indicate the ecological status in around sites which can be used when determining material impacts, risks, dependencies, and opportunities.
- The number and area (in hectares) of sites owned, leased or managed (labelled as direct operations) in or near these biodiversity sensitive areas.
- Metrics that can help identify material impacts related to the state of species.
Disclosure requirements related to ESRS 2 IRO-1 – Description of the processes to identify and assess material biodiversity and ecosystem-related impacts, risks and opportunities.
AR 4. The materiality assessment under ESRS E4 includes the undertaking’s:
(b) impacts on the state of species (i.e., species population size, species global extinction risk); [...]
AR 7. Phase 1 (LEAP approach) relates to the localisation of relevant sites regarding its interface with biodiversity and ecosystems. To identify these relevant sites the undertaking may:
(c) identify the current integrity and importance of biodiversity and ecosystem at each location taking into consideration the information provided in paragraphs 16 and 17;
(d) develop a list of locations where the undertaking is interfacing with locations in or near biodiversity-sensitive areas taking into consideration the information provided in paragraphs 16 and 17; and [...]
AR 8. In Phase 2, to evaluate its actual or potential impacts and dependencies on biodiversity and ecosystems for relevant sites, the undertaking may:
(c) indicate the size, scale, frequency of occurrence and timeframe of the impacts on biodiversity and ecosystems taking into consideration the disclosures under paragraphs 16 and 17. Furthermore, the undertaking may disclose:
i. the percentage of its suppliers’ facilities which are located in risk prone areas (with threatened species on the IUCN Red List of Species, the Birds and Habitats Directive or nationally list of threatened species, or in officially recognized Protected Areas, the Natura 2000 network of protected areas and Key Biodiversity Areas);
ii. the percentage of its procurement spend from suppliers with facilities which are located in risk prone areas.
- Species metrics to use in the materiality assessment to help assess the impact on the state of species.
- Metrics which indicate current integrity and importance of biodiversity and ecosystem at each location.
- A list of sites in or near biodiversity sensitive areas.
- A list of supplier sites in risk prone areas.
Disclosure Requirement E4-2 –Policies related to biodiversity and ecosystems.
AR 12. The undertaking may also provide information on how the policy refers to the production, sourcing or consumption of raw materials, and in particular how it:
(a) limits procurement from suppliers that cannot demonstrate that they are not contributing to significant damage to protected areas or key biodiversity areas (e.g., through certification);
- A list of supplier sites and whether they are in or near a protected areas or key biodiversity areas.
SFDR requires financial market participants to disclose sustainability risks and impacts, including biodiversity-related considerations. IBAT provides trusted biodiversity data to help investors assess nature-related risks, align with SFDR requirements, and make informed, responsible investment decisions.
Biodiversity related indicators and metrics under the SFDR:
Core indicators:
- Share of investments in investee companies with sites/operations located in or near to biodiversity-sensitive areas where activities of those investee companies negatively affect those areas
Additional indicators:
- Share of investments in investee companies whose operations affect threatened species
- Share of investments in investee companies without a biodiversity protection policy covering operational sites owned, leased, managed in, or adjacent to, a protected areaor an area of high biodiversity value outside protected areas
IBAT’s Disclosure Preparation Report (DPR) helps financial institutions align with SFDR biodiversity indicators by providing trusted spatial biodiversity data. By identifying whether investee companies operate in or near biodiversity-sensitive areas, protected areas, or regions of high biodiversity value, IBAT enables investors to assess potential nature-related risks and impacts. IBAT also supports evaluations of threatened species presence using STAR reports to identify threats to species in an area. This helps investors make informed, compliant, and responsible investment decisions.
Methodology and Buffers
The IBAT DPR uses a 2-stage approach to assess the sensitivity of sites.
Stage 1:
Asa first step, sites are defined as sensitive or not sensitive. This categorisation is based on a site’s overlap with significant biodiversity features in the IBAT datasets. The WDPA, WDKBA and IUCN Red List (in the form of the derived STAR metric) are used to assess if a site is sensitive.
Sites are defined as sensitive if:
- The area of influence (site and buffer) overlaps with a protected area or KBA.
- The area of influence (site and buffer) has STAR Threat Abatement and/or STAR Restoration scores exceeding the global median values of 0.01 and 0.003, respectively.
Stage 2:
A significance score is assigned to sensitive sites. Sites that are assessed as sensitive in stage 1 are assigned a significance score to aid the prioritisation of sites. Scores of high, medium, and low risks are presented. These are based on the proximity of the site to a KBA or protected area relative to the appropriate buffer size based on the type of operation or are based on the maximum STAR Threat Abatement and STAR Restoration scores found within the Area of influence (site + buffer). You can find more information about STAR here.
Table 1. Criteria used to assess the biodiversity significance of each location based on the proximity of the site to a Key Biodiversity Area or protected area relative to the appropriate buffer size based on the type of operation.
Buffer Distance
Type(s) of operation
Biodiversity Significance
None
Low
Medium
High
5 km
Offices, Warehouses, Low-input agriculture
> 5 km
1.5 - 5 km
0.5 - < 1.5 km
< 0.5 km
10 km
High-input agriculture, Onshore wind, Construction, Oil and gas (terrestrial)
> 10 km
3 - 10 km
1 - < 3 km
< 1 km
20 km
Offshore wind, Oil and gas (marine), Hydropower
> 20 km
6 - 20 km
2 - < 6 km
< 2 km
50 km
Mining
> 50 km
15 - 50 km
5 - < 15 km
< 5 km
Table 2. Criteria used to assess the biodiversity significance of each location based on the maximum STAR Threat Abatement and STAR Restoration scores found withing the area of impact (site + buffer).
Biodiversity Significance
Low
Medium
High
STAR Threat Abatement
Max STAR Threat Abatement value is < 0.05
Max STAR Threat Abatement value is between 0.05 – 0.15
Max STAR Threat Abatement value is > 0.15
STAR Restoration
Max STAR Restoration value is < 0.02
Max STAR Restoration value is between 0.02 – 0.05
Max STAR Restoration value is > 0.05
To assess the potential risks posed to biodiversity at each location, appropriate buffer sizes need to be used. While TNFD and GRI currently do not specify distance thresholds they use the terms “in the area of influence” or “in or near to” and this is where insights to distance can be useful. IBAT’s DPR report automatically applies different buffers to different operation types to effectively incorporate the area of influence of each location guided by available literature and expert knowledge. These buffers are also designed to account for potential inaccuracies in the global datasets (e.g., IUCN Species Ranges). A “default”buffer size of 20 km is applied to operations which cannot be categorised under the types of operations outlined in table 3. It should be noted that this buffer size is a guide and may not accurately reflect the real-world risks posed to biodiversity features, which could be greater or lower than the risks reported.
Buffer distance
Type(s) of operation
Justification
References
5km
Offices, Warehouses, Low-input agriculture.
A 5 km buffer is recommended as the minimum buffer size to be used. Low-input agriculture is placed here as the degree of freshwater pollution is expected to be lower (see 10 km buffer justification).
UNEP-WCMC, The Area of Influence of site-based operations – Direct Impacts (2021). UNEP-WCMC, The Area of Influence of site-based operations – Indirect Impacts (2022).
10 km
High-input agriculture, Onshore wind, Construction, Oil and gas (terrestrial)
A 10 km buffer is suggested as being likely to cover the impacts from most pressures (Amec Foster Wheeler 2015; UNEP-WCMC 2021). Freshwater pollution impacts are likely to be experienced at larger distances (e.g., average of 13.4 km for mines and oil and gas operations (UNEP-WCMC 2021)). As agriculture is one of the main contributors to eutrophication and pollution globally (Poore & Nemecek 2018) it is deemed that a 10 km buffer is most relevant.
Amec Foster Wheeler (2015) Habitats Regulations Assessment:14th Onshore Oil and Gas Licensing Round (No. Doc Ref. 33917rr008i2). Oil and Gas Authority. UNEP-WCMC, The Area of Influence of site-based operations – Direct Impacts (2021). J. Poore, T. Nemecek, Reducing food’s environmental impacts through producers and consumers. Science. 360, 987–992 (2018).
20 km
Offshore wind, Oil and gas (marine), Hydropower
Marine operations have the potential to have larger areas of influence when compared to terrestrial, especially if noise is excessive. UNEP-WCMC suggested a buffer size of 20 km for marine oil and gas operations (UNEP-WCMC 2021) and a 20 km buffer is also likely to be sufficient to account for a majority of wide-ranging species (Weaver J 2020).
UNEP-WCMC, The Area of Influence of site-based operations – Direct Impacts (2021). Weaver J, “WALES NATIONAL DEVELOPMENT FRAMEWORK - Habitats Regulations Assessment” (Sefydliad Materion Cymreig | Institute of Welsh Affairs, 2020).
50 km
Mining
Mining has been observed to contribute to deforestation effects up to 50 km away (Sonter et al. 2017; Maddox et al. 2019).
L. J. Sonter, D. Herrera, D. J. Barrett, G. L. Galford, C. J. Moran, B. S. Soares-Filho, Mining drives extensive deforestation in the Brazilian Amazon. Nature Communications. 8, 1013 (2017). T. Maddox, P. Howard, J. Knox, N. Jenner, Forest-Smart Mining: Identifying Factors Associated with the Impacts of Large-Scale Mining on Forests (World Bank, 2019).
Investment in the future of our planet
Subscription fees are invested into the maintenance and development of critical global biodiversity datasets: the IUCN Red List of Threatened Species, the World Database on Protected Areas, and the World Database of Key Biodiversity Areas.

Reports
IBAT offers a variety of reports to suit all of your reporting needs. All reports can be accessed via Pay As You Go or as part of one of our subscriptions.
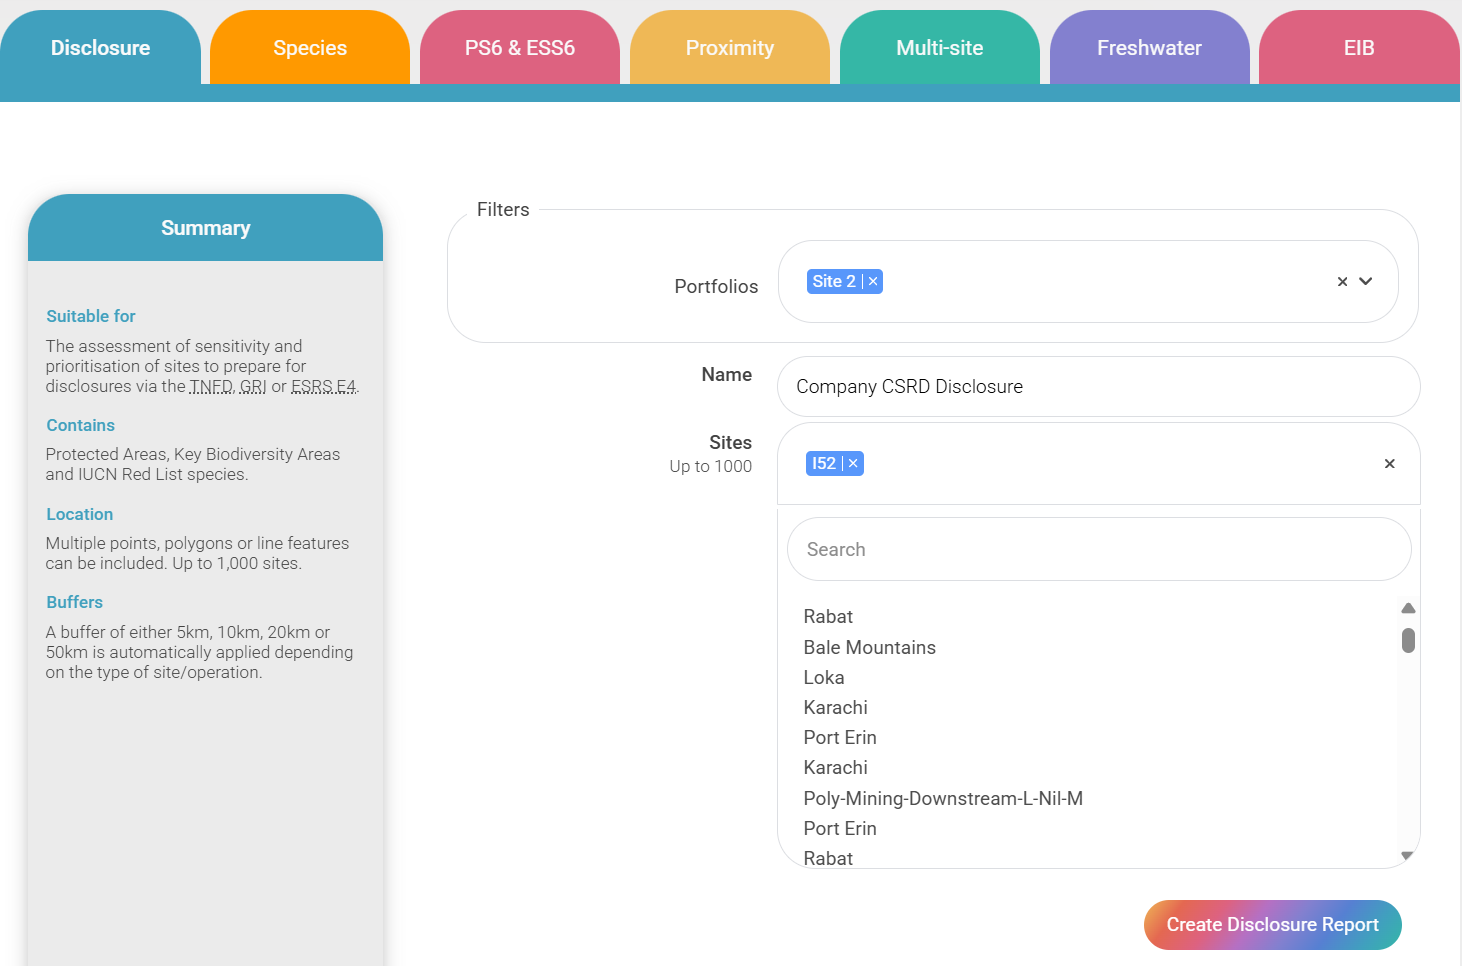
PROXIMITY
Suitable for - High-level early stage biodiversity risk screening
Contains - Protected areas, Key Biodiversity Areas & IUCN Red List Species
Location - Single
Buffers - User specified
PS6 & ESS6
Suitable for - High-level early stage biodiversity risk screening against IFC and World Bank performance standards
Contains - Protected areas, Key Biodiversity Areas & IUCN Red List Species
Location - Single
Buffers - Defaulted to 50km
Likelihood of Critical Habitat flagged
STAR
Suitable for - Identification of opportunities for positive biodiversity actions and target setting
Contains - IUCN Red List Species (Birds, Mammals and Amphibians)
Location - Single
Buffers - N/A
FRESHWATER
Suitable for - High-level early stage biodiversity risk screening of projects with potential to impact on freshwater ecosystems
Contains - Freshwater species upstream and downstream of a specified location
Location - Single
Buffers - Select upstream and downstream
MULTI-SITE
Suitable for - Incorporating biodiversity into annual sustainability reporting (e.g. reporting against GRI or SASB standards)
Contains - Protected areas, Key Biodiversity Areas & IUCN Red List Species
Location - Multiple
Buffers User specified
Recognised across key biodiversity frameworks
Leveraging IBAT data ensures that your organisation stays at the forefront of credible biodiversity data insights, analysis, and reporting. IBAT is cited by major frameworks, including CSRD ESRS E4, TNFD,GRI, CDP, and the Science Based Targets for Nature.
GIS DOWNLOAD
Suitable for - Complete spatial data for a specific region of interest
Contains - Choose from either Core Datasets (IUCN Red List, WDPA, WDKBA) or Derived Datasets (STAR & Rarity-weighted species richness)
Location - Up to 1,000,000 km2
PS6 & ESS6
Suitable for - Complete global spatial data
Contains - Protected areas, Key Biodiversity Areas & IUCN Red List Species
Only available to Enterprise subscribers
Additional Information
PDF Report
Summary of protected areas and Key Biodiversity Areas overlapped for each buffer and IUCN Red List of Threatened Species for a 50km buffer.
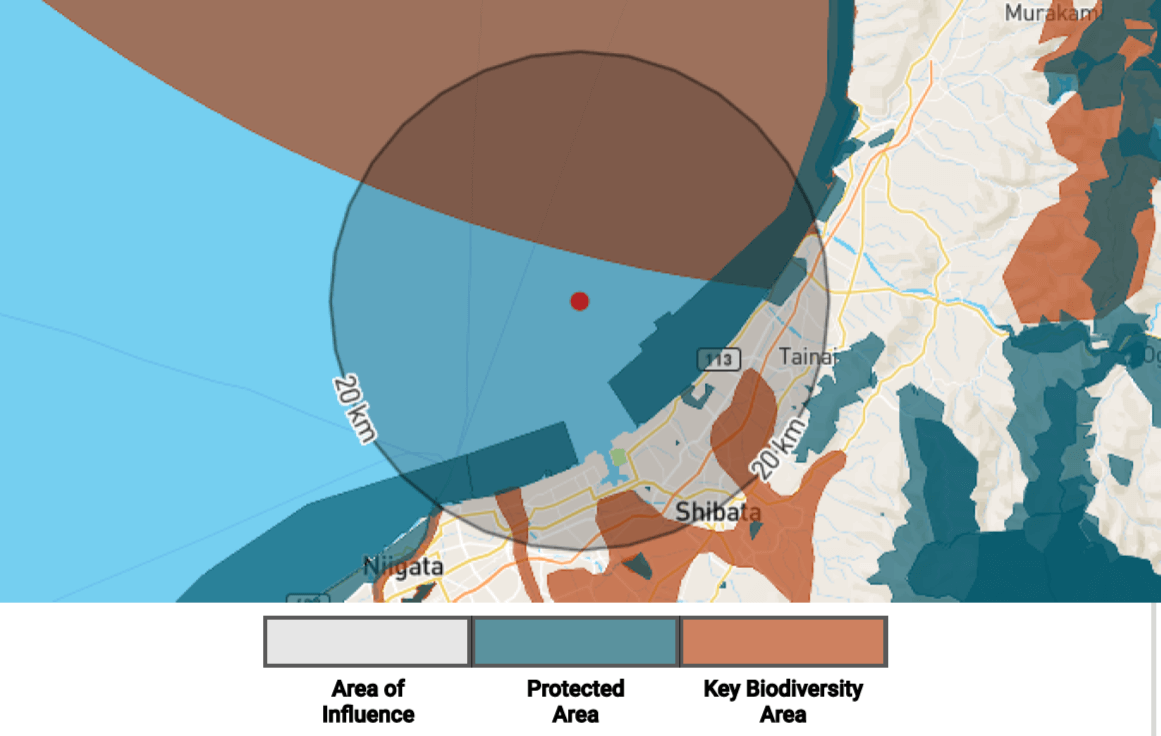
PNG Files
Two .png files showing the outline of the site and chosen buffers in relation to protected areas and Key Biodiversity Areas.
CSV Files
Full attribute lists of protected areas and Key Biodiversity Areas for each buffer selected and IUCN Red List Species for a 50km buffer.
README
A README file containing an overview of the IBAT platform, limitations, a disclaimer and recommended citations.
Use Case
High-level early stage biodiversity risk screening for a single site.
Buffers
Select up to three buffers between 1km and 50km for your geometry.
PDF Report
Summary of protected areas and Key Biodiversity Areas overlapped for 1km, 10km and 50km buffers, as well as their likelihood to trigger critical habitat. IUCN Red List Species within a 50km buffer and restricted range species.
PNG Files
Two .png files showing the outline of the site and buffers in relation to protected areas and Key Biodiversity Areas.
CSV Files
Full attribute lists of protected areas and Key Biodiversity Areas for each buffer and IUCN Red List Species for a 50km buffer.
README
A README file containing an overview of the IBAT platform, limitations, a disclaimer and recommended citations.
Use Case
High-level early stage biodiversity risk screening for a single site with specific reference to PSS6 and ESS6.
Buffers
Predefined at 10km and 50km.
PDF Report
STAR Threat Abatement and Restoration scores for species located within an Area of Interest with maps displaying spatial variation in STAR opportunities. Scores for Threat Abatement and Restoration are disaggregated by threat type. IBAT's STAR Briefing Note and Business User guidance also included as PDFs.
Zip Files
4 CSV Files containing the breakdown of STAR Threat Abatement and Restoration scores by threat type, and for each grid cell. For Enterprise and Enterprise Plus Subscribers, an additional CSV File containing a list of the individual species present in the AOI
README
PDF “README” containing recommended use of IBAT and limitations.
Use Case
Identification of opportunities for positive biodiversity actions and target setting, as well as screening for investment opportunities or risks. When combined with additional information, STAR can also be used for mitigation/offset planning.
PDF Report
Summarises freshwater species in hydrobasins upstream and downstream of a specified location within the specified buffers.
CSV Files
One file for each of the buffers specified (as well as the exact site basin) containing IUCN Red List species for a 50km buffer.
README
A README file containing an overview of the IBAT platform, limitations, a disclaimer and recommended citations.
Use Case
High-level early stage biodiversity risk screening for a single site with potential to impact freshwater ecosystems.
Buffers
Select four buffer ranges to be assessed both upstream and downstream of the given location.
PDF Report
Protected areas, Key Biodiversity Areas and IUCN Red List Species visualised and compared across a portfolio of sites. Includes total and mean STAR Threat Abatement and Restoration Scores for each site.
CSV Files
Five files detailing the protected areas and Key Biodiversity Areas within chosen buffer of each site, IUCN Red List category counts for each site, total and mean STAR scores for each site and a summary overlaps table.
README
A README file containing an overview of the IBAT platform, limitations, a disclaimer and recommended citations.
Use Case
Incorporating biodiversity into annual sustainability reporting (e.g. reporting against GRI or SASB standards).
Buffers
Select a single buffer to be applied to all sites.
Testimonials
Hear what our partners have to say...
"IBAT also allows me to integrate my analysis with other GIS tools, which increases the depth of my scrutiny. We are looking forward to utilising the new STAR functionality!"

"IBAT provides up-to-date information on protected area designations and threats to habitat and biodiversity. These data inform the BeZero Carbon Rating, an assessment of the likelihood that a carbon credit delivers on its promise to achieve a tonne of CO2e avoided or removed."

"IBAT provides an excellent pre-screening desktop resource to be used in these assessments focusing on species, habitats and legally protected and or internationally recognised areas of biodiversity importance."

"IBAT has been an essential tool to help Evonik understand our biodiversity risks and opportunities on-site."

"IBAT provides essential screening on threatened species and endangered habitats that helps us assess risks, focus accompanying investigations, and prioritise restoration activities at our operating sites globally."

Learn how IBAT can transform your relationship with data and support your nature-positive goals
